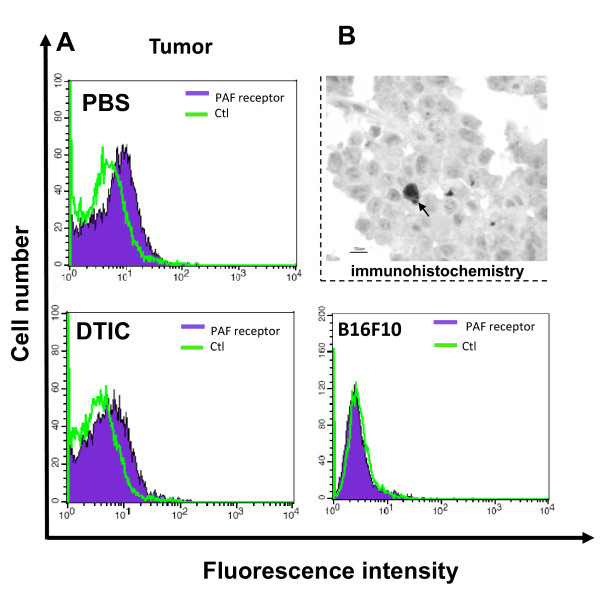
Figure 5.
PAF-R is expressed within the tumour microenvironment. (A) The presence of PAF-R was evaluated by FACS analysis in cell suspensions from B16F10-derived tumours (histograms on the left). Examples from either mock (PBS) or dacarbazine (DTIC)-treated animals are illustrated. The histograms shown represent the negative control (ctl) and reactivity with the antibody to PAF-R. Cells from within the tumours stained positively with the antibody to PAF-R. The histogram on the right represents the absence of reactivity for the antibody to PAF-R in B16F10 cells grown in vitro. (B) Immunohistochemistry of B16F10-derived tumours using the same antibody to PAF-R, showing specific reactivity to a few cells infiltrating the tumours, consistent with the notion that only a subpopulation of cells within the tumour microenvironment express the PAF-R (arrow indicates a stained cell).

