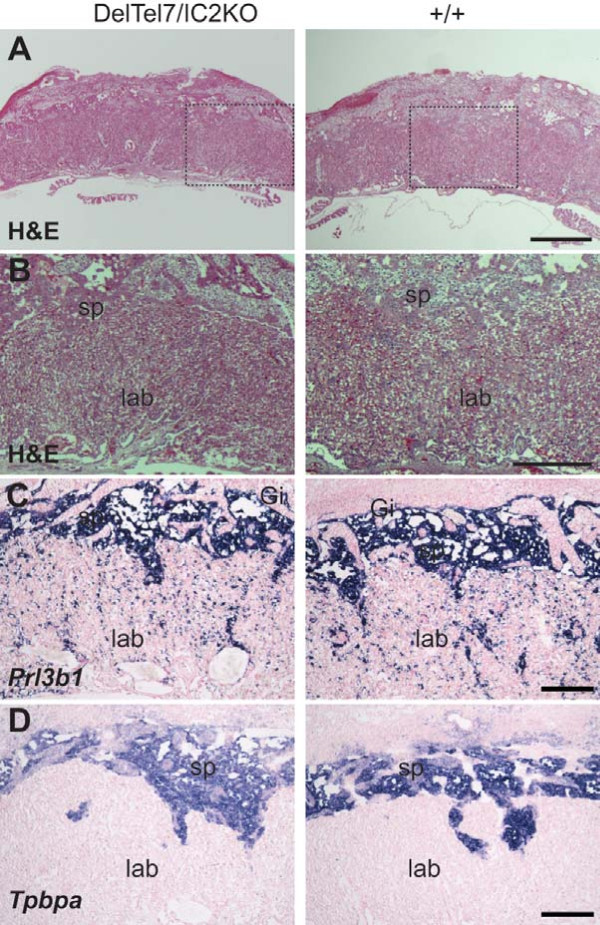
Figure 3.
Overall placental architecture of the DelTel7/IC2KO placentae at E14.5 by representative H&E and ISH. A) H&E stain of DelTel7/IC2KO placentae (n = 5) compared with wild type (+/+; n = 5). Scale bar: 1 mm. B) Zoom-in of boxed regions in panel A. Scale bar: 0.5 mm. C) Analysis of Prl3b1 (Pl-II) expression by ISH of DelTel7/IC2KO placentae (n = 5) compared with wild type (n = 6). Scale bar: 0.25 mm. D) Tpbpa (4311) ISH of DelTel7/IC2KO placentae (n = 4) compared with wild type (n = 4) Scale bar: 0.25 mm.

