Figure 9.
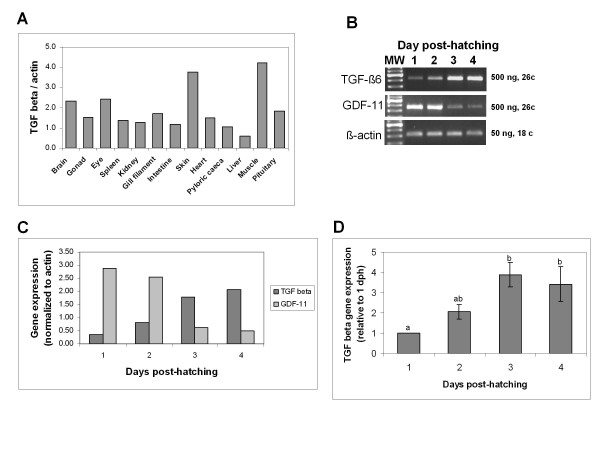
Gene expression of TGF-β6 in different tissues and during development. Total RNA prepared from different tissues excised from a single adult fish (A) and RNA from pools of larvae collected on 1-4 days after hatching (B, C, D) was reverse-transcribed using oligo(dT) and subjected to PCR amplification of TGF-β6. β-actin was used as a control for equal amounts used in RT-PCR. Amplified products were analyzed on 1.5-2% agarose gels and photographed under UV illumination following staining with ethidium bromide and then a densitometric analysis was performed. The expression of TGF-β6 was compared to that of another member of the TGF-β family, GDF-11. The results are presented as a ratio to that of β-actin. (C) Quantification of the expression results shown in panel (B). (D) Mean of TGF-β6 expression in three different batches of larvae collected May 1992, March 1994 and May 1994 expressed as a ratio to that of β-actin. The values are presented relative to 1 day post-hatching (dph) which is considered as 1. Different letters indicate significant difference (P < 0.05).

