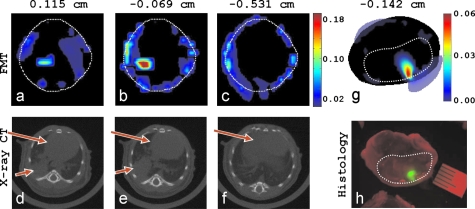
Figure 3.
Tomographic reconstructions of lung and brain tumor in mice (as viewed toward the anterior direction). (a), (b), and (c) FMT axial slices of the Angioscence 750 concentration (arb. units) at three different y positions. The white dotted line is the mouse boundary. (e) and (f) The corresponding x-ray CT axial slices; small arrows are the tumor, and big arrows are the liver and heart. (g) FMT of the mCherry brain tumor, and (f) histology fluorescence image of the corresponding axial head section; dotted line is the brain boundary.

