Figure. Radiology and clinical neurophysiology.
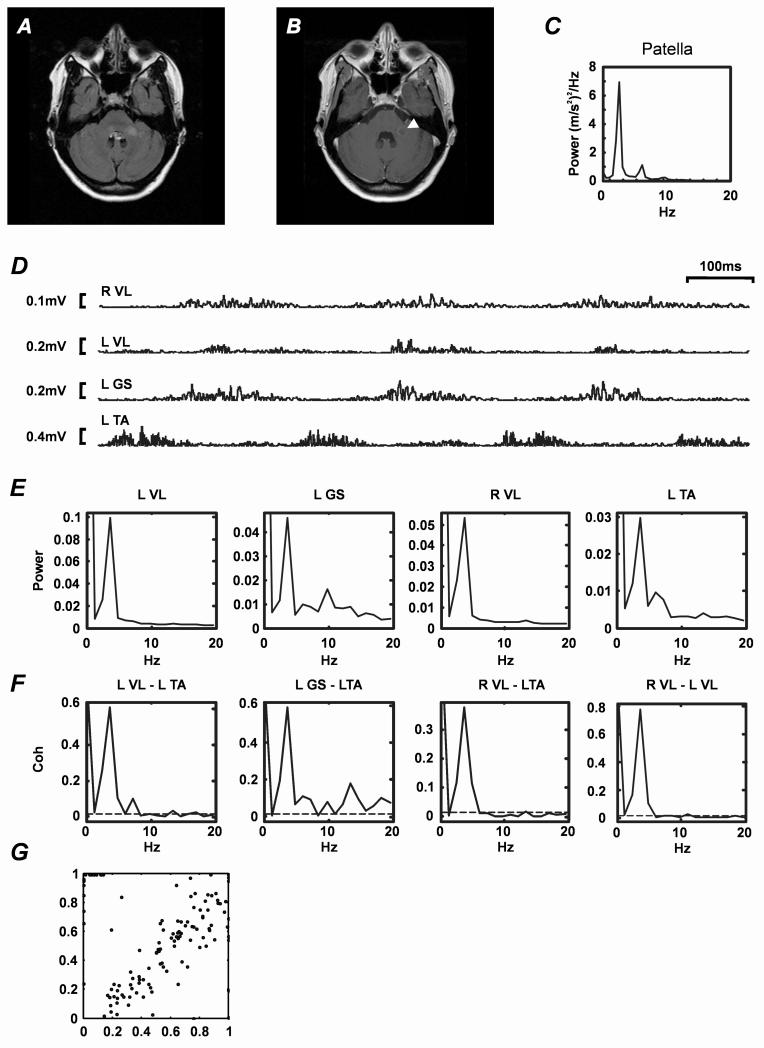
A. MRI brain. Axial FLAIR sequence showing left middle cerebellar peduncle (brachium pontis) lesion consistent with demyelination. B. Equivalent axial gadolinium enhanced T1-weighted MRI sequence. Note that the area of active inflammation (indicated by arrow head) co-localises with the lesion shown in A. C. Tremor power spectrum (data obtained from accelerometer attached to the left patella during stance). D. Rectified EMG recorded from left tibialis anterior (L TA), left gastrocnemius-soleus (L GS), left vastus lateralis (L VL) and right vastus lateralis (R VL) muscles while the patient was standing. Each trace represents one second of data. EMG bursts have a duration of approximately 100 ms (see timebase, top right). Voltage calibration bars are shown to the left of each trace. E. EMG power spectra (expressed as a fraction of total power) derived from EMG recordings illustrated in A (data length 340s). F. Intermuscular coherence spectra. Muscle pairs used to calculate coherence spectra are indicated above each plot. Data points above the dashed lines indicate significant coherence (P<0.05)15 G. Phase resetting plot. Each point represents the effects of one tendon tap stimulus delivered to the patella tendon. Abscissa represents phase of 4Hz oscillation in patella acceleration prior to a tap and ordinate represents phase one cycle following stimulation; phase in both cases is expressed as a fraction of an oscillation cycle. Linear dependence indicates that the tap stimulus did not affect the phase of ongoing tremor.

