Fig. 4.
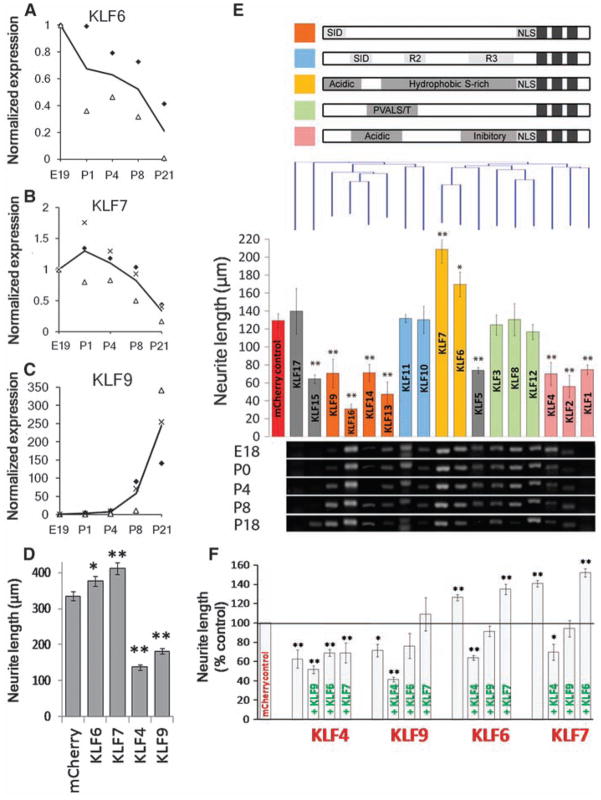
Multiple KLF family members are developmentally regulated in RGCs and differentially affect CNS neurite growth. (A to C) RGCs from multiple ages were purified by immunopanning and analyzed by qRT-PCR. Transcript abundance is normalized to E19. KLF6 (A) and KLF7 (B) decrease more than 5-fold postnatally, whereas KLF9 (C) increases 250-fold. Each marker type is a separate experiment, and the line shown is the average; N = 2 to 3. (D) P4 RGCs were cotransfected with KLFs and EGFP and plated for 2 days on laminin. Bars represent average total neurite length of transfected (EGFP+) neurons [n > 700; *P < 0.05, **P < 0.01; analysis of variance (ANOVA) with post hoc Dunnett’s test; mean ± SEM; pooled data from two replicate experiments]. (E) P5 cortical neurons were cotransfected with individual KLFs and mCherry, plated for 3 days on laminin, and immunostained for β-III tubulin. (Top) KLF family members are grouped according to defined structural domains (27) and clustered by amino acid similarity (Clustal analysis, Vector NTI). (Middle) Bars represent average total neurite length of transfected (mCherry+) neurons and are colored by the presence of known motifs (above). Nine KLFs significantly decreased neurite length, and two increased neurite length (N > 3, n > 100; *P < 0.05, **P < 0.01, ANOVA with post hoc Dunnett’s test; mean ± SEM). (Bottom) Purified RGCs from different ages were analyzed by RT-PCR with KLF-specific primers, ordered according to the overlying bar graph. Transcripts for all KLFs except KLF1 and -17 were detected in developing RGCs. (F) P5 cortical neurons were cotransfected with combinations of KLFs with IRES-mCherry (red) or IRES-EGFP (green) reporters and cultured as above (DNA loading controls, fig. S13). Bars represent average neurite length of dually transfected neurons (mCherry+, EGFP+). Coexpression of KLF4 or -9 blocked the growth-promoting effects of KLF6 or -7 (N = 3, n > 25; *P < 0.05, **P < 0.01, ANOVA with post hoc Dunnett’s test; mean ± SEM).

