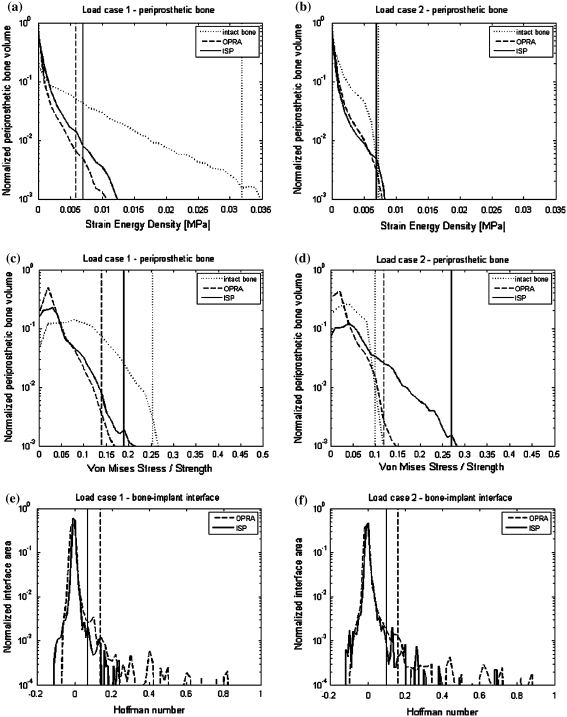
FIGURE 5.
Area/volume distribution of the SED (a, b), the von Mises stress/strength (c, d) in the periprosthetic bone region and the Hoffman number (e, f) at the bone–implant interface obtained from the simulations with bonded interface for the load case 1 (a, c, e) and load case 2 (b, d, f). Vertical lines mark 1% peak thresholds

