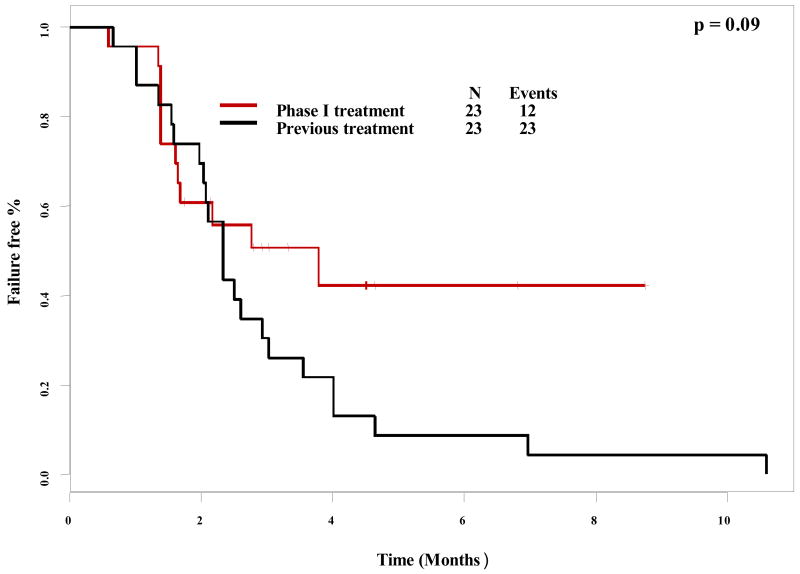
Figure 3. Paired time to treatment failure comparison (2nd phase I trial vs. last conventional treatment).
Paired time-to-treatment failure as plotted by Kaplan-Meier for second phase I therapy compared to the last conventional treatment before referral to the phase I clinic. Tic marks represent patients still on treatment and therefore censored at the time shown. There was a trend, albeit not statistically significant, towards a longer time-to-treatment failure for patients' second phase I trial as compared to their last conventional treatment.

