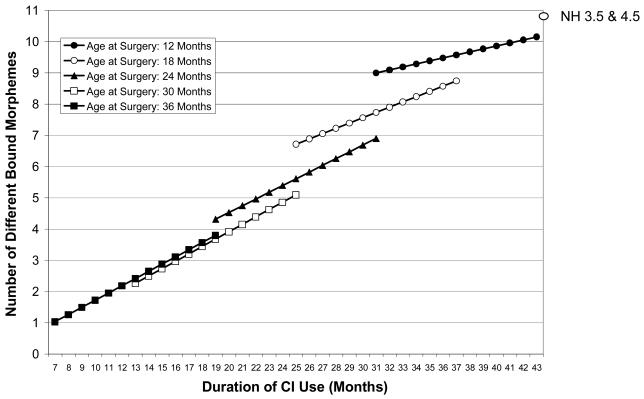
Figure 4. Number of Different Bound Morphemes.
Each figure shows, for selected surgery ages, the relationship between duration of implant use and an outcome variable. These figures were derived in the following way. For a given surgery age and assuming the grand mean for pre-implant aided threshold, a duration slope and intercept were calculated from the HLM equations (see Tables 4 and 5). These were obtained by multiplying the appropriate Level 2 coefficients by the particular surgery age (as a deviation from the group mean of 21 months) or its square (pre-implant aided threshold was centered at its grand mean and so assumed a value of 0 in these calculations). The duration centering constant is 24 months, representing two years of use. By using these centering constants, the Level 1 constant and slope coefficients are the expected values for a subject with a median surgery age. The constant is further the expected outcome for a participant with a median surgery age and two years of implant use. The resulting surgery-age-specific slope and intercept coefficients were then used to generate the predicted outcomes for different values of duration (a range of duration values were selected that were typical for the particular surgery age). The resulting figures thus show the expected outcome values given different surgery ages and durations of implant use.

