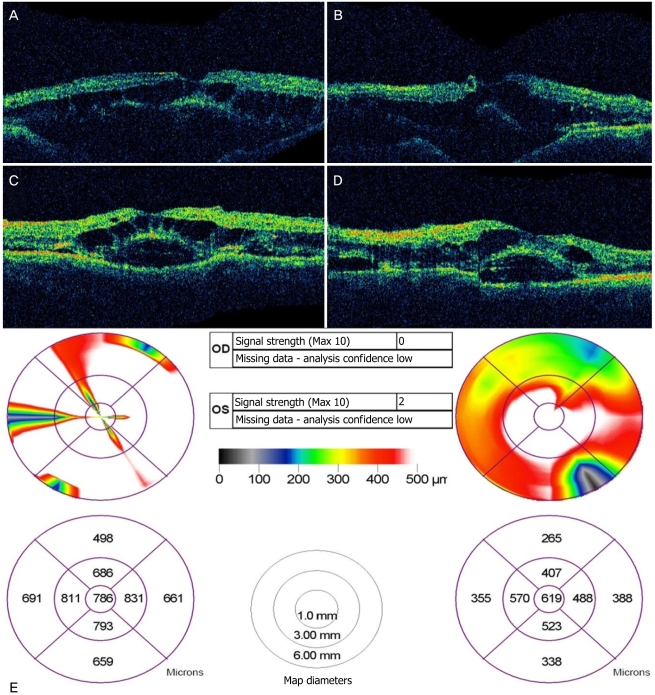
Fig. 3.
Optical coherence tomography images through the foveas of both eyes revealed severe cystic changes in the foveal area and a high elevation of the neurosensory retina and the retinal pigment epithelium. (A,B) Retinal map of the right eye. (C,D) Retinal map of the left eye. (E) Retinal thickness map of both eyes. OD=oculus dexter; OS=oculus sinister.

