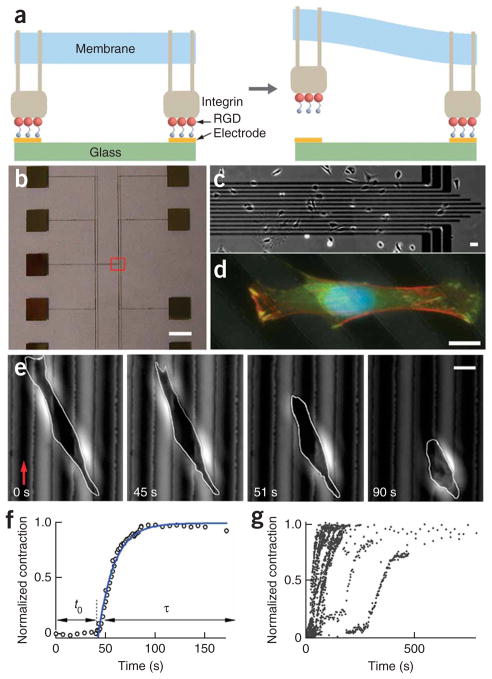
Figure 1.
Programmed subcellular release. (a) Left schematic illustration showing RGD-integrin complexes formed at RGD-terminated thiols on gold electrodes. Right, electrochemical desorption of the tethered RGD peptide from a gold electrode, triggered by a small voltage pulse, results in local release of the RGD-integrin complexes. (b) Photograph of a device showing the electrode array (center of the device) and contact pads. (c) Low-resolution phase contrast image of one end of the electrode array (red box in b), with cells plated on the device. (d) Overlaid fluorescence images of a fixed 3T3 fibroblast spanning multiple electrodes (dark diagonal lines) stained for actin fibers (Alexafluor 568 phalloidin, red), vinculin (FITC anti-vinculin, green) and cell nucleus (DAPI, blue). (e) Phase contrast images during a typical cell release experiment. A voltage was applied to an electrode (red arrow) at t = 0 s. After release of the cell from the gold line on the left, there was an induction period before the cell began to contract. Scale bars, 4 mm (b), 40 μm (c) and 10 μm (d,e). (f) Plot of normalized cell contraction versus time for the cell shown in e. The induction time (t0) and contraction phase (τ) are indicated by the arrows. The solid line is a fit to the equation ΔL(t)/ΔLm = 1 − exp(−(t−t0)/τ), with t0 = 43 s and τ = 16 s. (g) Plot of the normalized cell contraction curves for 22 cells.

