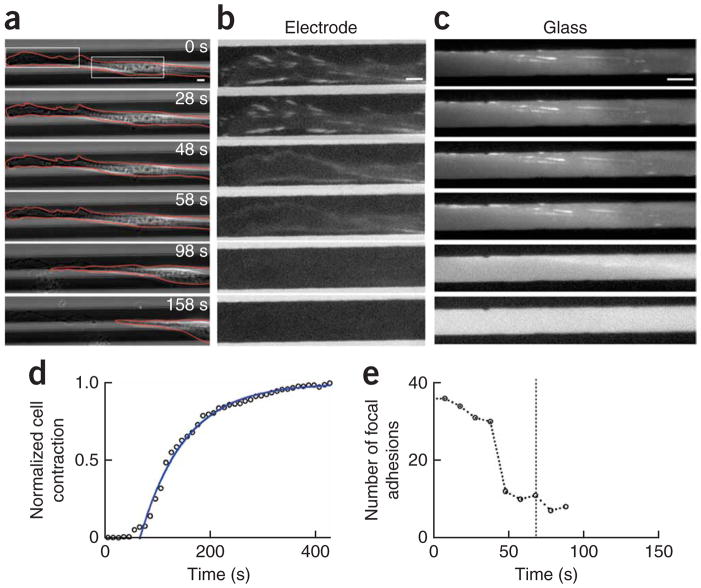
Figure 3.
Cell detachment and focal adhesion dynamics. (a) Phase contrast images of cell release (top electrode) of a 3T3 fibroblast transfected with GFP-paxillin. Cellular debris is seen along the contraction trajectory after release (98 and 158 s). (b) Fluorescence images of the regions of the cell (left box in a): focal adhesions on the release electrode during release and cell contraction (the contrast was enhanced for clarity; see Supplementary Methods. (c) Fluorescence images of the regions of the cell in a indicated by the white box at the right: focal adhesions on the glass during release and cell contraction. All bars, 5 μm. (d) Normalized cell contraction versus time for the cell in a with t0 = 68 s and τ = 85 s. (e) The total number of focal adhesions versus time for the cell shown in a.

