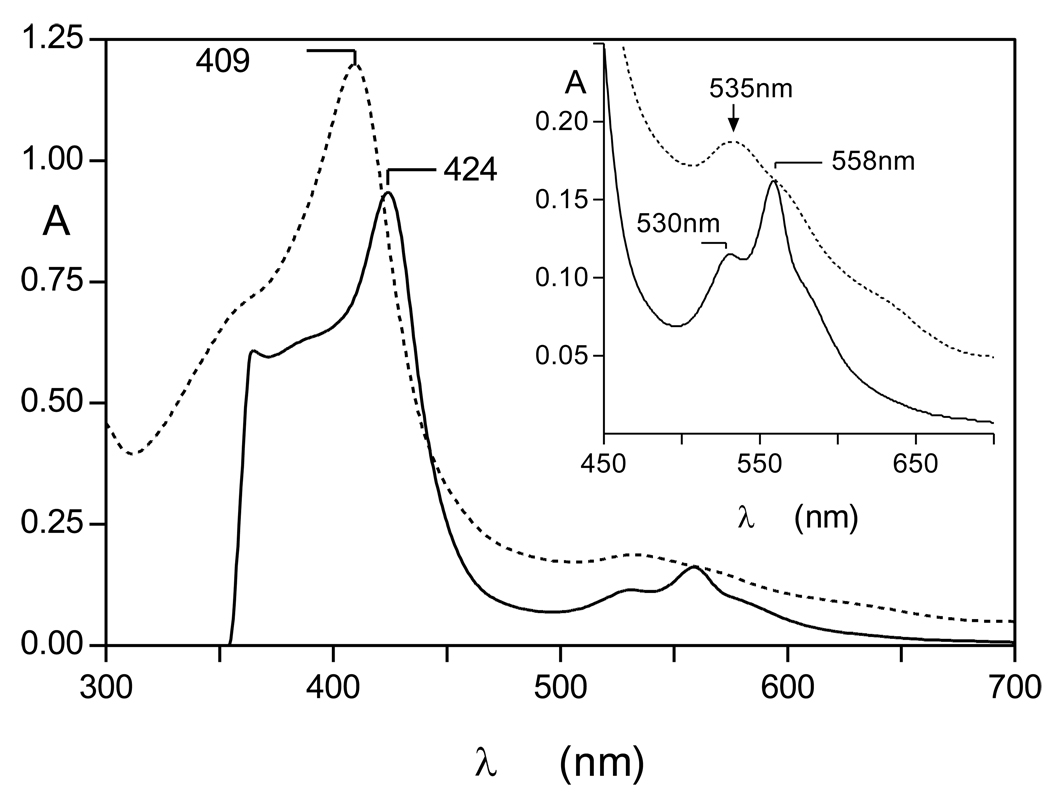
Figure 2.
UV-visible spectrum of the haemoglobin haemichrome formed after longer incubation of oxyhaemoglobin with interpain A at pH 7.5. The haemichrome produced after 24h incubation (dotted line) gave rise to a haemochrome spectrum upon addition of 10mM Na2S2O4 (solid line). Incubation conditions and enzyme and haemoglobin concentrations were as for Figure1. Inset shows the Q-band region.

