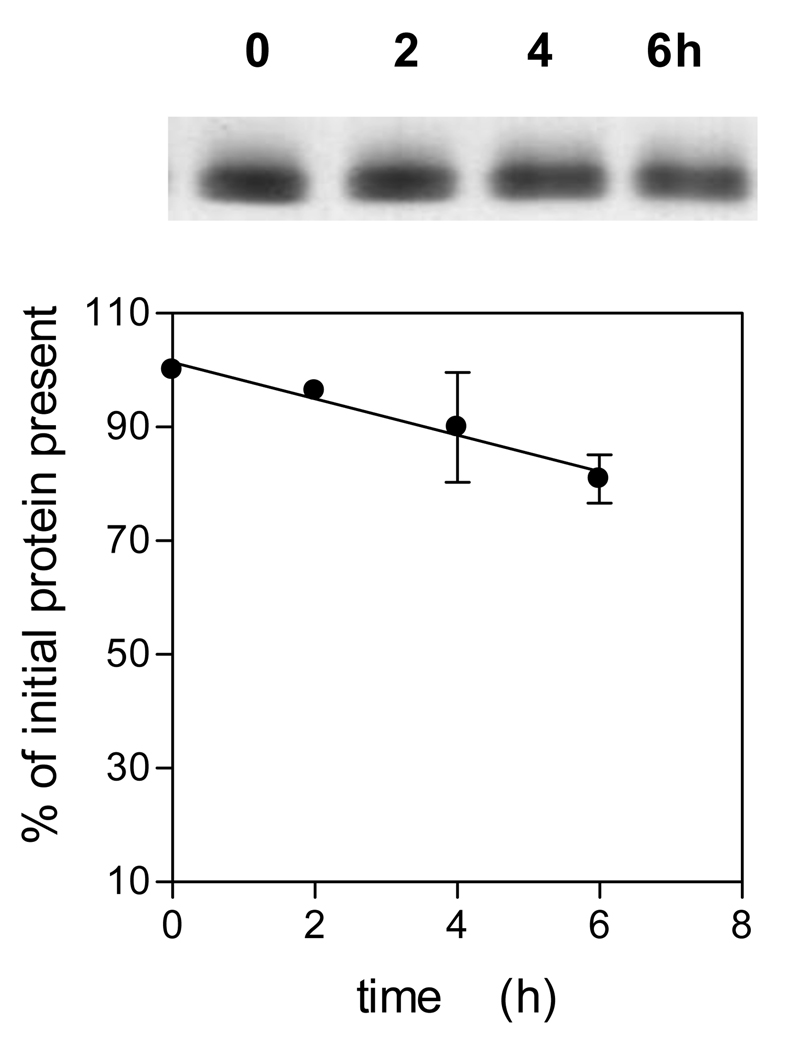
Figure 3.
SDS-PAGE of oxyhaemoglobin during incubation with interpain A.
Incubation conditions and enzyme and substrate conditions were as described for Fig 1. The gel was stained with coomassie blue and densitometrically scanned to quantify the loss of protein during incubation, and expressed as % of initial protein present. Samples were solubilised by heating at 100°C for 5 min. The data points represent the mean and standard deviation of three separate experiments.

