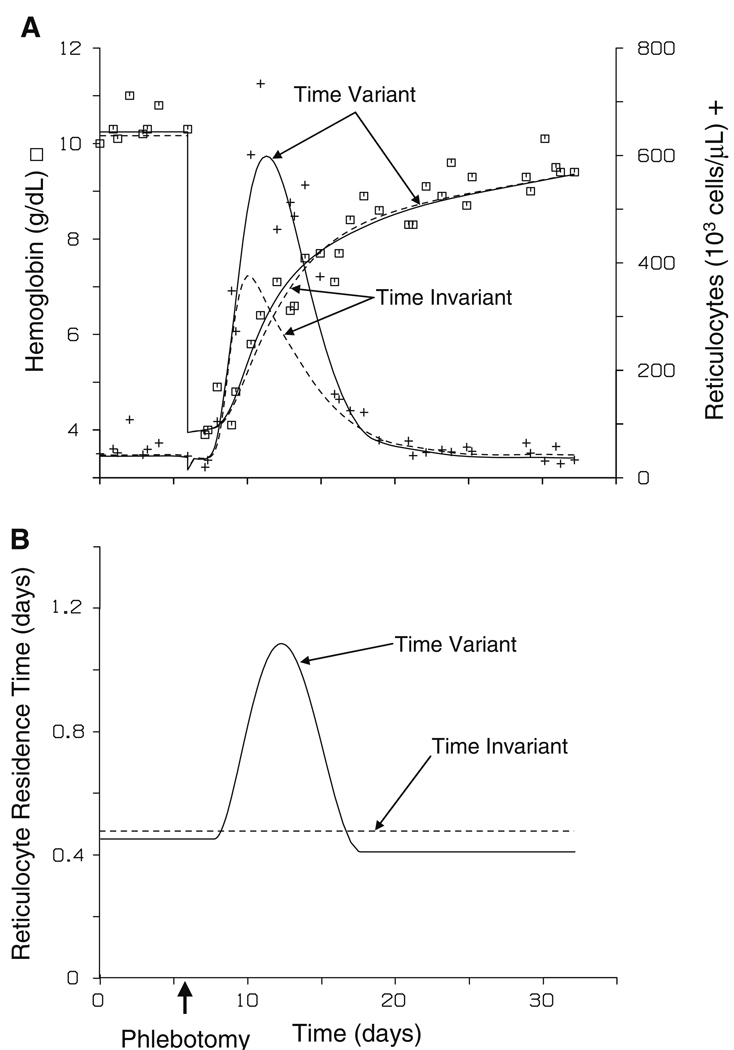
Fig. 6.
Representative subject fit to observed hemoglobin (□) and reticulocyte (+) count concentrations using a time variant or time invariant reticulocyte residence time model (panel A). The lines represent the predicted hemoglobin and the predicted reticulocyte count concentration. The solid lines (—) are the predicted values with the time variant model and the dashed lines (--) are the predicted values with the time invariant model. Panel B displays the determined reticulocyte residence times, τ(t), of cells currently being stimulated for the representative subject using the time variant (—) or time invariant (--) model

