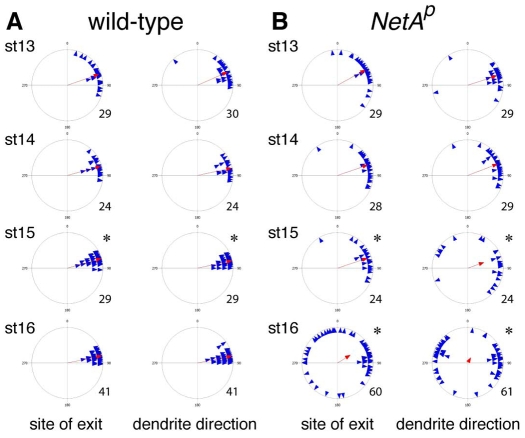
Fig. 4.
Refinement of v'ch1 dendrite position and orientation does not occur in Netrin-A Drosophila embryos. Each blue triangle in these scatter plots shows the values for an individual dendrite, and the red arrow shows the mean value for that parameter (r value). n values are indicated to the right of each plot. (A) Asterisks indicate that the distributions at stage 15 are significantly different from previous stages (Watson's U2 test, P<0.05). (B) Asterisks indicate that the distributions at stage 15 and 16 are significantly different from wild-type at equivalent stages (Watson's U2 test, P<0.05).

