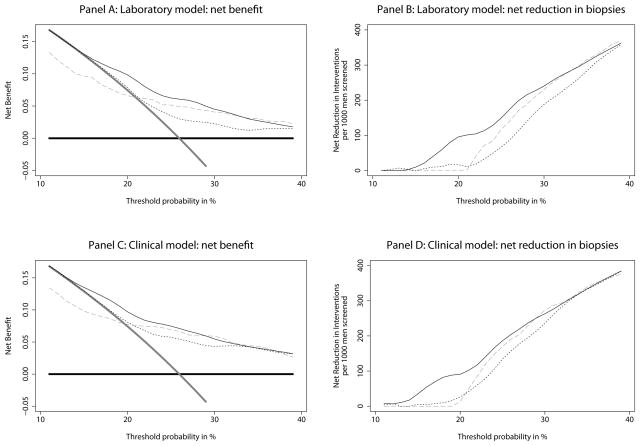
Figure 3.
Decision curves, showing the estimated clinical benefit of various biopsy strategies. Panels A and B: Laboratory models. Thick grey line: biopsy all men. Thick black line: biopsy no man. Thin black line: biopsy on the basis of the laboratory kallikrein model (age, total PSA, free PSA, intact PSA, and hK2). Dotted line: biopsy on the basis of free PSA, total PSA and age. Grey dashed line: biopsy using the laboratory kallikrein model developed for unscreened men. Panels C and D: Clinical models. Thick grey line: biopsy all men. Thick black line: biopsy no man. Thin black line: biopsy on the basis of the clinical kallikrein model (age, DRE, total PSA, free PSA, intact PSA, and hK2). Dotted line: biopsy on the basis of free PSA, total PSA, age and DRE. Grey dashed line: biopsy using the clinical kallikrein model developed for unscreened men.

