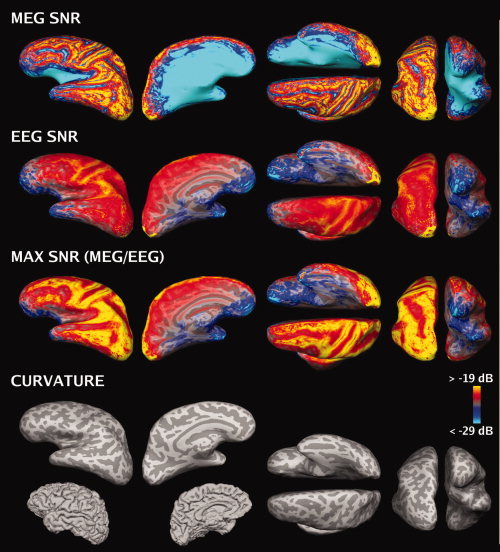
Figure 2.

SNR maps based on the noise model (group average, left hemisphere, plotted on Subject 2's brain). The color scale is identical in each SNR map. The SNR estimates plotted on the cortical surface: SNRMEG (first row), SNREEG (second row), maximum of SNRMEG and SNREEG (third row). Fourth row: inflated cortical curvature maps and folded cortex maps. Convex areas (gyri) and concave areas (sulcal walls) are indicated in light and dark gray, respectively.
