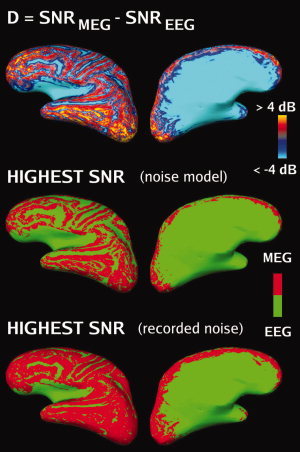
Figure 3.

Difference (D) SNR maps (group average, left hemisphere, plotted on the brain of Subject 2). Top row: Difference (D) maps based on the noise model. Middle row: D maps based on the noise model thresholded at D = 0. Red: D > 0 (MEG higher SNR), green: D < 0 (EEG higher SNR). The sulci, narrow crests of gyri, the insula and the medial surface of the cortex all indicate higher SNR in EEG, while other locations show higher SNR in MEG. Bottom row: D maps based on recorded noise thresholded at D = 0.
