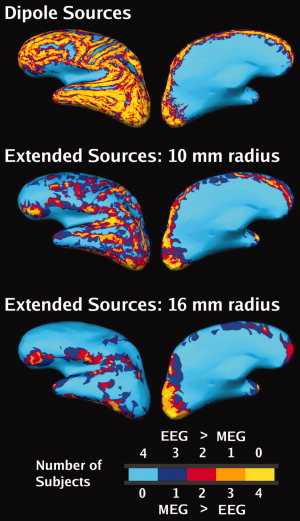
Figure 4.

Effect of the extent of the source on SNR maps (noise model, group average, left hemisphere, plotted on subject 2's brain). Top row: Dipoles. Middle row: Extended patch sources, radius = 10 mm. Lower row: Extended patch sources, radius = 16 mm. The color code indicates at each location the number of subjects that have SNRMEG > SNREEG (i.e. D > 0). For example, areas colored yellow exhibited D > 0 in all four subjects at that location. The intermediate colors indicate locations with greater between‐subject variability.
