
Figure 5.
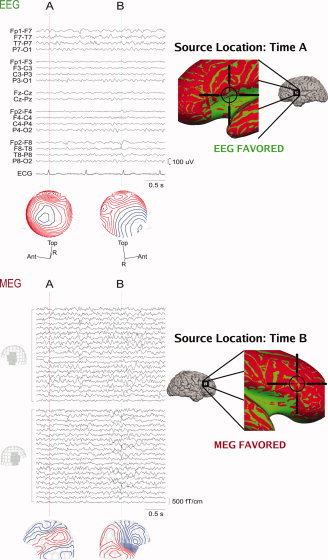
MEG and EEG recording from an epileptic patient. Left, above: The EEG signals (standard clinical bipolar montage) and potential distributions at time instants A and B. Left, below: MEG signals in left and right frontotemporal planar gradiometers and the corresponding field distributions at times A and B. The spike at time A can be more easily detected from the EEG data whereas the spike at time B is more prominent in the MEG signals. Right: The locations of the spike sources at times A and B estimated with an equivalent current‐dipole model are superimposed on the difference SNR maps (green: SNREEG > SNRMEG, red: SNRMEG > SNREEG). Pial cortex maps are shown as well as expanded SNR maps in the region of the dipole source. The SNR maps correctly identify the modality that best represents the spikes at times A and B respectively.