
Figure 3.
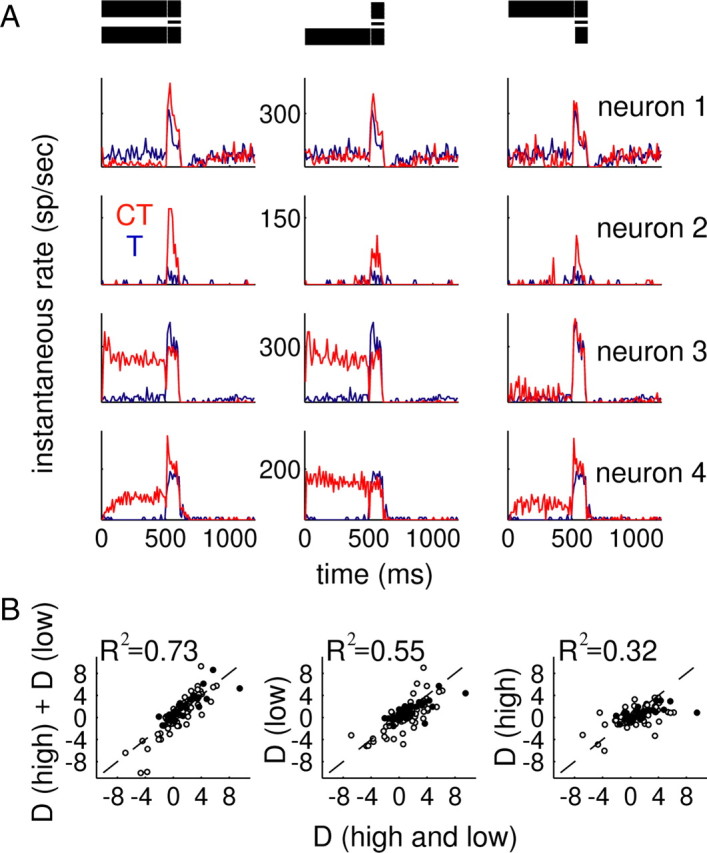
Below-BF energy in the conditioner drives more enhancement and suppression than above-BF components. A, Single-neuron examples of CT (red) and T (blue) responses for four cells also tested with the above- and below-BF conditioner components presented in isolation. Neurons 1 and 2 were tested using a 1 octave notch; neurons 3 and 4 were tested with a ½ octave notch. Ordinate value ranges are fixed for each neuron (labeled in the middle panels); T responses are identical across the three columns. B, Scatter plots of D values computed from isolated above- or below-BF conditioner components as a function of D values observed when the high- and low-frequency sides were presented simultaneously (abscissa). Two different NWs were used: ½ octave (open circles; n = 71) and 1 octave (filled circles; n = 32). Most neurons were tested with a 60 dB SL stimulus (n = 70); subsets of responses using lower-level sounds (40 dB SL, n = 21; 20 dB SL, n = 12) are also included.