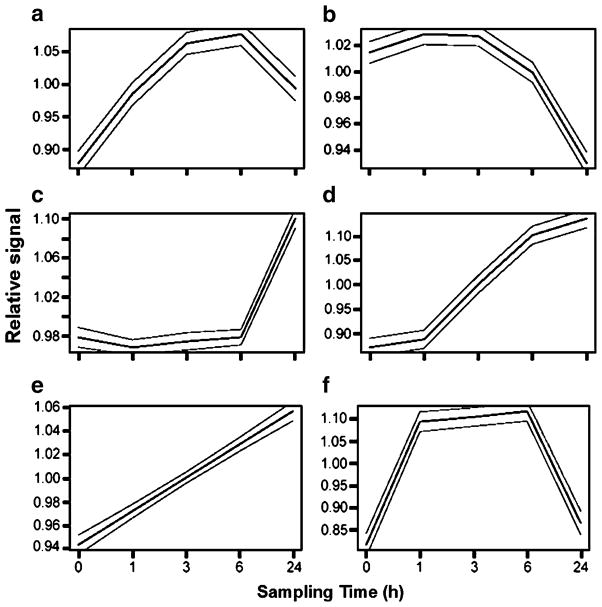
Fig. 2.
Time-course clusters (95% confidence intervals) for ESTs in which transcription level differed among sampling times in gill of heat-shocked (40°C, 1 h) oysters before and at 1, 3, 6, and 24 h after heat shock. Data were clustered using the software SSClust (Ma et al. 2006). The vsn-transformed data for each sampling time are presented relative to the average for all sampling times for a given EST

