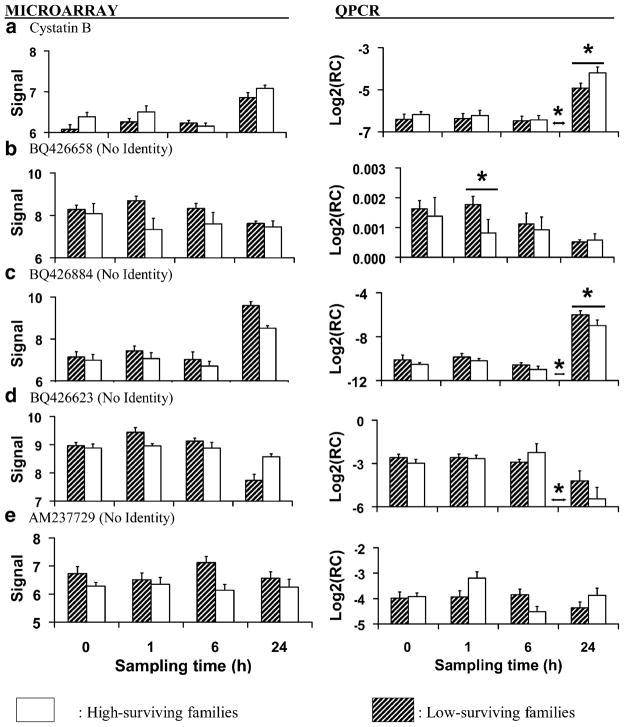
Fig. 5.
Average (±SEM) microarray-generated vsn-adjusted signal data and RT-QPCR-generated relative concentration data (target concentration relative to elongation factor 1; RC or Log2RC) for genes involved in cellular immunity measured in gill before and at 1, 6, and 24 h after heat shock (40°C, 1 h). Each bar represents three replicates of two families (six samples total) with either low survival (hatched bars) or high survival (white bars) after heat shock. Asterisks above or between individual sampling times indicate significant (P<0.05) differences between family types at that time or between sampling times, respectively

