Fig. 4.
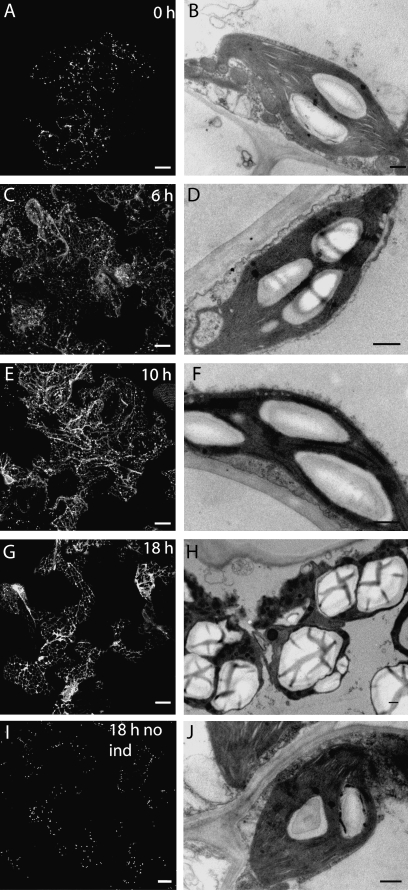
(A, C, E, and G) Micrographs showing a time course of Sar1-GTP induction in stable inducible tobacco leaf epidermal cells expressing ST–GFP (A, C, E, G, scale bars=20 μm). (A) Control cells show a typical fluorescent punctate Golgi body signal. (C) At 6 h after induction some ER fluorescence can be seen. (E) At 10 h after induction the GFP signal in ER membranes becomes clear and with a faint Golgi signal. (G) At 18 h after induction almost all the Golgi signal is relocated to the ER. Electron micrographs show cells fixated at the same time points (B, D, F, H, scale bars=500 nm). (B) Mesophyll cell before induction. Many plastids contain starch granules. (D) After 6 h a slight increase in the amount of starch in induced plants can be observed. (F) At 10 h after induction there is a further increase in starch content and size of grains. (H) After 18 h large starch granules almost fill the plastid volume and cells begin to die. Golgi labelling and starch content were unaffected in NII control plants without the inducible Sar1-GTP vector (I, J, scale bars=20 μm). (I) The ST–GFP signal is unaffected after 18 h dexamethasone treatment under the same conditions. (J) No significant increase of starch can be observed.

