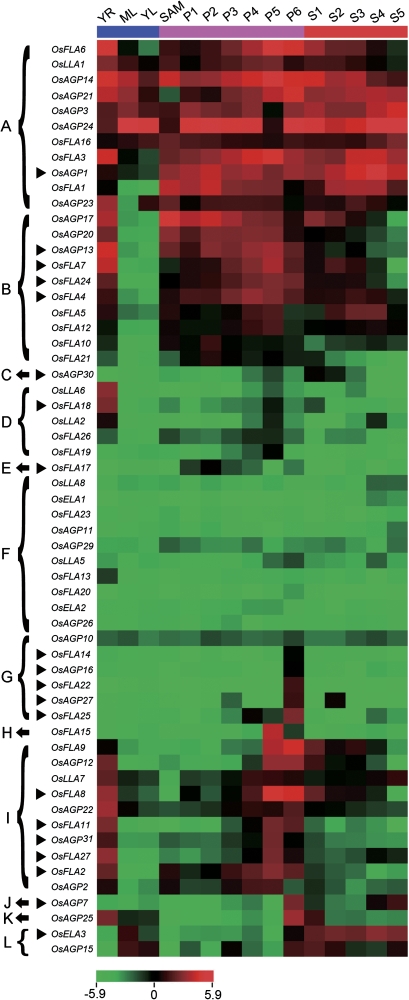
Fig. 6.
Expression profiles of AGP-encoding genes in various rice organs and tissues at different development stages. The microarray data sets (GSE6893) of gene expression at various developmental stages were used for cluster display. A heat map representing hierarchical clustering of average log signal values of all the AGP-encoding genes in various organs and tissues at different developmental stages (indicated at the top of each lane). The genes which share similar expression patterns are divided into 12 clusters: (A) all examined tissues; (B) all examined tissues except ML and YL; (C) S1 and S2; (D) YR and P5; (E) P3; (F) low expression in all examined tissues; (G) P6; (H) P5; (I) YR, P5, and P6; (J) P6, S4, and S5; (K) YR, P6, and S1; (L) YL, ML, P6, and S1–S6. The representative AGP-encoding genes differentially expressed during various stages of development for which real-time PCR analysis was performed are indicated by a black triangle on the left. The colour scale (representing average log signal values) is shown at the bottom.

