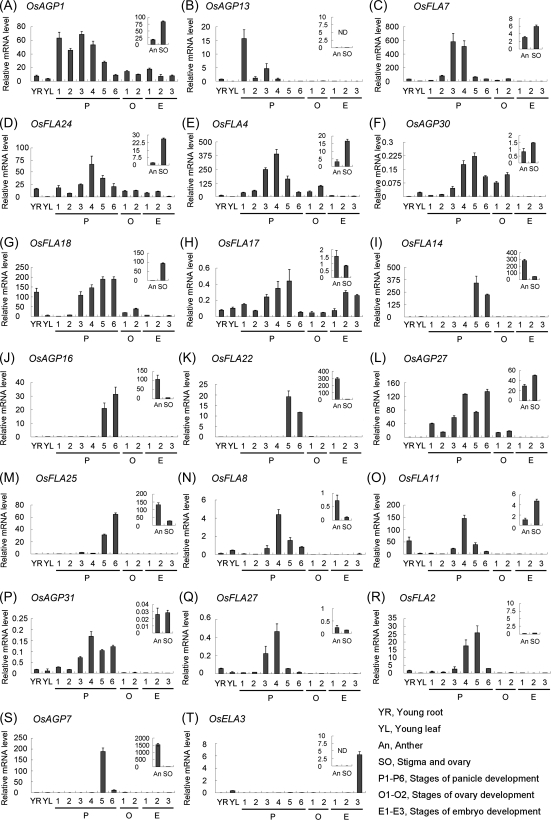
Fig. 7.
Real-time PCR analysis for confirmation of the differential expression of representative AGP-encoding genes in various organs and tissues at different development stages. The small pictures inserted in the figures represent their relative expression levels in anther (An) and stigma and ovary (SO) from 28 cm panicles.

