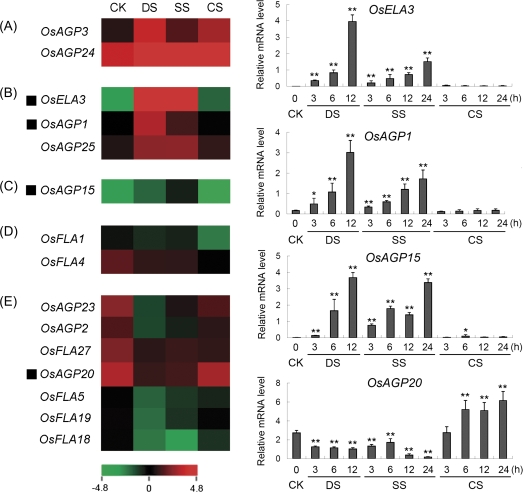
Fig. 8.
Expression profiles of rice AGP-encoding genes differentially expressed under abiotic stresses. The microarray data sets (GSE6901) of gene expression under various abiotic stresses were used for cluster display. The average log signal values of AGP-encoding genes under control and various stress conditions (indicated at the top of each lane) are presented by a heat map. Only those genes that exhibited ≥2-fold differential expression, under any of the given abiotic stress conditions, are shown. (A) Up-regulated by drought, salt, and cold stresses; (B) up-regulated by drought and salt stresses; (C) up-regulated by salt stress; (D) down-regulated by cold stress; (E) down-regulated by drought and salt stresses. The representative AGP-encoding genes differentially expressed under different abiotic stress conditions for which real-time PCR analysis was performed are indicated as a black triangle to the left. The results of real-time PCR analysis for confirmation of the differential expression of rice AGP-encoding genes under abiotic stresses are shown on the right. Two asterisks (**, P <0.01) and one asterisk (*, 0.01<P < 0.05) represent significant differences between the controls and treatments as determined by Origin 7.5. The mRNA levels for each candidate gene in different organ and tissue samples were calculated relative to its expression in control seedlings. The colour scale (representing average log signal values) is shown at the bottom. CK, control; DS, drought stress; SS, salt stress; CS, cold stress.

