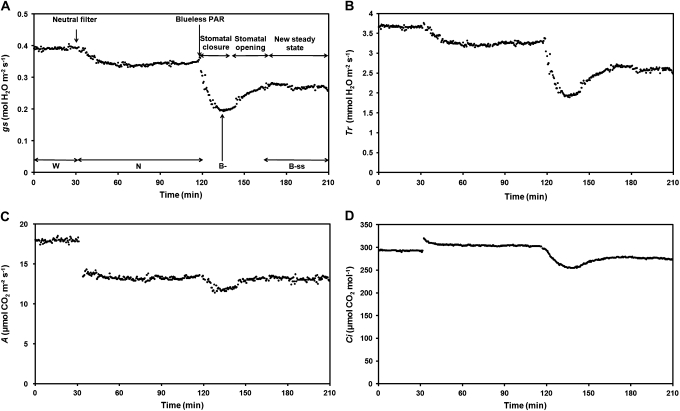
Fig. 3.
Typical responses of stomatal conductance (A), transpiration rate (B), assimilation rate (C), and intercellular CO2 concentration (D) to the light treatments in a younger plant. Leaves were first placed under white light (W: PAR=486 μmol m−2 s−1, Blue=101 μmol m−2 s−1) and were then submitted to a neutral shade (N: PAR=322 μmol m−2 s−1, Blue=61 μmol m−2 s−1). Finally, blue light was reduced to 1.80 μmol m−2 s−1 (PAR=277 μmol m−2 s−1) while maintaining an equivalent photosynthetic efficiency. Distinction was made between minimal values reached under blueless PAR treatment: B– (maximum effect of the blueless PAR treatment) and the new steady-states reached 45 min after blue light reduction (B–ss).

