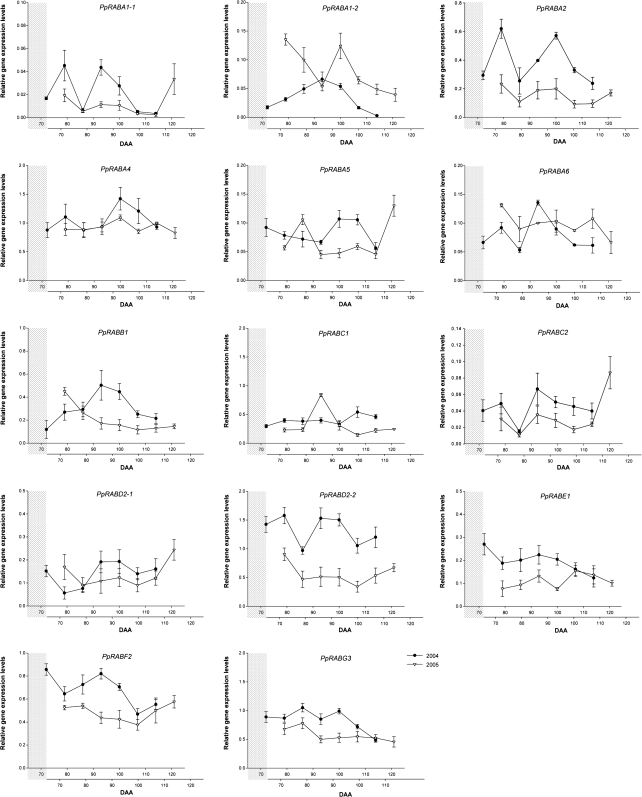
Fig. 4.
Relative gene expression levels of PpRAB GTPase-encoding genes in peach fruit mesocarp (PpRABA–PpRABG), evaluated by real-time PCR in 2004 (filled circles) and 2005 (open triangles). DAA, days after anthesis. The lower x-axis shows DAA from 2005 shifted ahead, as shown by the grey shaded area, to allow the best alignment of gene expression profiles from the two years, as explained in the text.

