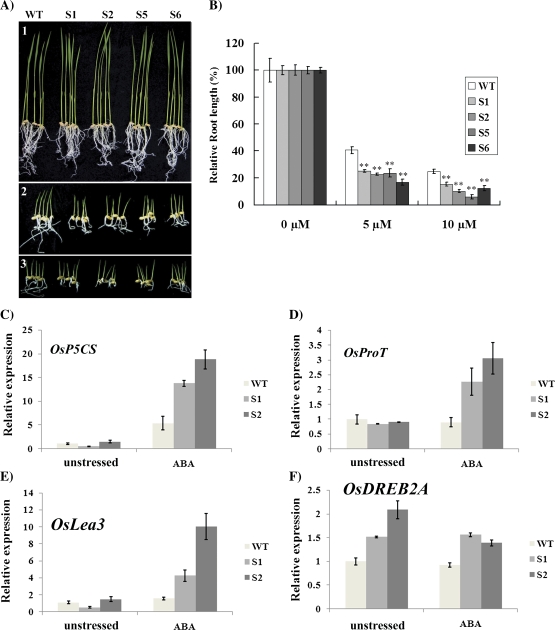
Fig. 7.
Seedling development of ZFP179-ox transgenic rice plants under ABA treatment. (A) The WT control and transgenic lines were grown under 0 μM, 5 μM, and 10 μM ABA (1–3). (B) The relative root length of each WT and transgenic lines was measured and the error bars are based on three replicates. The values with significant difference according to the t test are indicated by asterisks (**, P ≤0.01). (C–F) The transcript levels of OsP5CS, OsProT OsLea3, and OsDREB2A were measured by quantitative real-time PCR under unstressed conditions and 0.1 mM ABA for 24 h, respectively. 18S-rRNA was used as an internal control. Data represent means and standard errors of three replicates. (This figure is available in colour at JXB online.)

