
Figure 2.
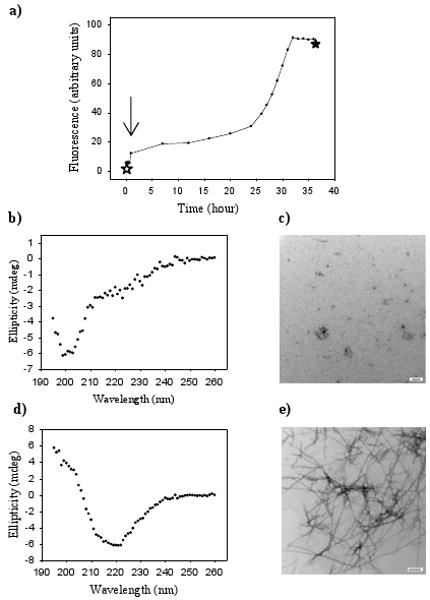
The Ser-20-IAPP switch peptide does not aggregate but forms amyloid after a pH jump. (a) Thioflavin-T fluorescence vs time. The pH jump occurred at the point indicated by the arrow. (b) CD spectrum recorded at the time point indicated by the ✩ before the pH jump. (c) TEM image recorded before the pH jump (✩). (d) CD spectrum recorded at the time point indicated by the ★ after the pH jump and after amyloid formation is completed. (e) TEM image recorded after amyloid formation is completed (★). Scale bars in the TEM images represent 100 nanometers.