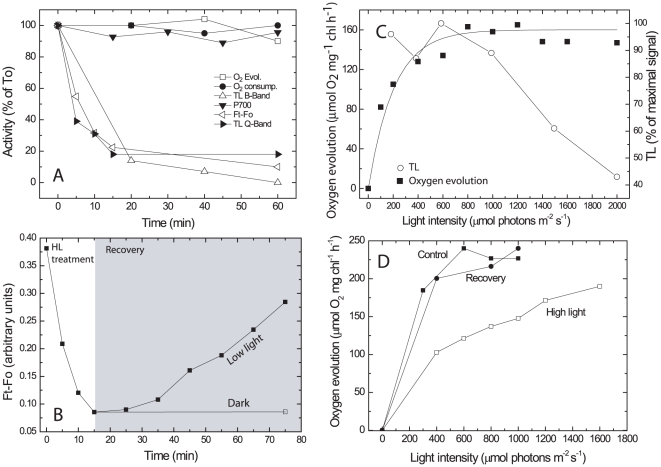
Figure 3. Effect of excess light treatment on electron flow parameters.
A. Microcoleus cells (10 µg chl ml−1, optical path 1.5 cm) were exposed to 2000 µmol photons m−2 s−1 for different durations and the various parameters were measured at indicated times. In different experiments the 100% values corresponded to 160–270 µmol O2 mg chl−1 h−1 evolved in light and 40–100 µmol O2 mg chl−1 h−1 taken up in darkness; Maximal Ft–Fo at time zero of excess illumination was 0.37, measured using a FL3000 fluorimeter (see Fig. 2). TL, 9000–11,000 photons s−1; P700 oxidation −3×10⁻⁴ ΔI/I (TL measurements were performed after a saturating flash provided at −22°C; the maximal B-band emission was at 25°C). B. Cell suspension (10 µg chlorophyll ml−1) was exposed to 1200 µmol photons m−2 s−1 for 17 min to trigger loss of fluorescence (Ft–Fo) as measured by the FL3000 fluorimeter. The light intensity was then reduced to 50 µmol photons m−2 s−1 or darkness and recovery of fluorescence emission was measured for 60 min. C. Cells (12 µg chl ml−1) were exposed to various light intensities for 17 min followed by measurements of O2 evolution and TL B band emission. D. The rate of O2 evolution as a function of light intensity by control and cells exposed for 17 min to 2000 µmol photons m−2 s−1 and followed by 50 min recovery at 70 µmol photons m−2 s−1. Note: Each experiment presented here was performed several times using independent cell cultures. The patterns of the results presented are characteristic examples, however standard deviation values were not plotted.

