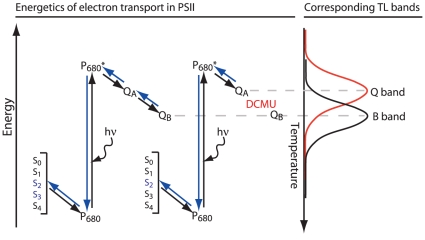
Figure 8. A schematic presentation of electron transport within PSII and the resulting TL bands.
The QA and QB quinones, P680 and the Mn cluster S-states are shown. Forward electron transport is represented by plain arrows and back electron transport by blue arrows. Changes in the peak temperature observed in TL experiments can be used as an estimate for the recombination energy of the QB −S2/QBS1 and QB −S3/QBS2 (B-band) or QA −S2/QAS1 (Q-band) redox pairs. To observe the Q band emission, reduction of the QB site was blocked by herbicides that bind specifically to this site. The electron released from P680 by light excitation at subzero temperatures can reach the QA site and, in the presence of herbicides that bind to the QB site, recombine upon warming with the oxidized S2 state by back electron flow producing the Q band. Since the energy gap between QA − and P680 + is smaller than that from QB − to P680 + (B band), lower activation energy is required for this recombination and thus the Q band is observed at lower temperatures.

