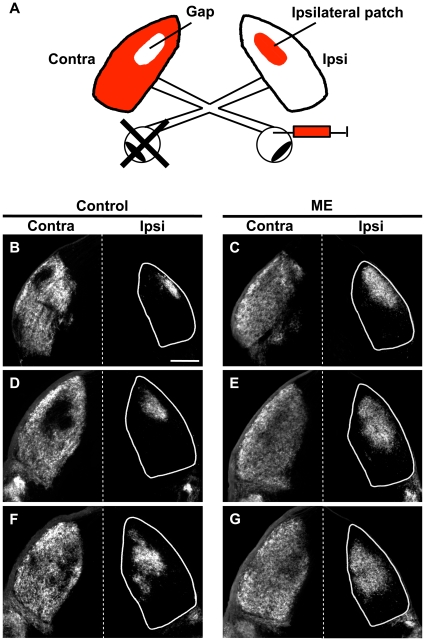
Figure 1. Effects of ME after eye-specific segregation on the remaining retinogeniculate projections in the mouse dLGN.
(A) A schematic of experimental procedures. ME was performed at P10, and CTB was injected into the other eye to visualize the remaining RGC axons. Contra and ipsi indicate contralateral and ipsilateral sides to the CTB-injected eye, respectively. The locations of the gap and the ipsilateral patch are also shown. (B–G) Coronal sections of 50 µm thickness were prepared from control (B, D, F) and ME-treated (C, E, G) mice between P35–P37. Representative images of the rostral (B, C), middle (D, E), and caudal (F, G) dLGN are shown. White lines show the boundaries of the dLGN. In each panel, the top is dorsomedial. Scale bar represents 200 µm.

