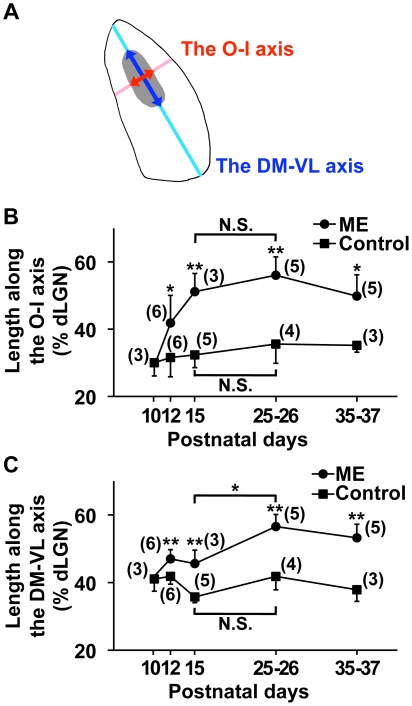
Figure 5. ME-induced rearrangement of retinogeniculate projections along the O-I and DM-VL axes.
ME was performed at P10, and CTB was injected into the other eye. Coronal sections through the dLGN ipsilateral to the CTB-injected eye were prepared at the indicated time points, and the ipsilateral patches (gray area) were extracted from the CTB-positive areas. (A) A diagram of the dLGN showing the O-I and DM-VL axes. The lengths of the ipsilateral patch along the DM-VL axis (dark blue arrow) and the O-I axis (dark red arrow) were divided by the lengths of the dLGN along the DM-VL axis (light blue line) and the O-I axis (light red line), respectively (see Figure S5 for details). The values are shown in panels B and C. (B) The lengths of the ipsilateral patch along the O-I axis were significantly larger in ME-treated mice than in age-matched control mice at P15. Note that the lengths did not show significant differences between P15 and P25–P26 in ME-treated mice, suggesting that the expansion reached its maximum within 5 days. (**) P<0.01, (*) P<0.05, (N.S.) not significantly different (P≥0.05), unpaired Student's t-test for comparisons between ME-treated and control mice, and Tukey-Kramer test for comparisons between different ages within either the ME-treated group or the control mouse group. Error bars represent S.D. The numbers in parentheses indicate the number of animals. (C) The lengths of the ipsilateral patch along the DM-VL axis were significantly larger in ME-treated mice than in age-matched control mice. In contrast to the lengths along the O-I axis, the length along the DM-VL axis in ME-treated mice at P25–P26 was significantly larger than that at P15. (**) P<0.01, (*) P<0.05, (N.S.) not significantly different (P≥0.05), unpaired Student's t-test for comparisons between ME-treated and control mice, and Tukey-Kramer test for comparisons between different ages within either the ME-treated group or the control mouse group. Error bars represent S.D. The numbers in parentheses indicate the number of animals. These results suggest that the expansion of the ipsilateral patch along the DM-VL axis is relatively slow compared with that along the O-I axis.

