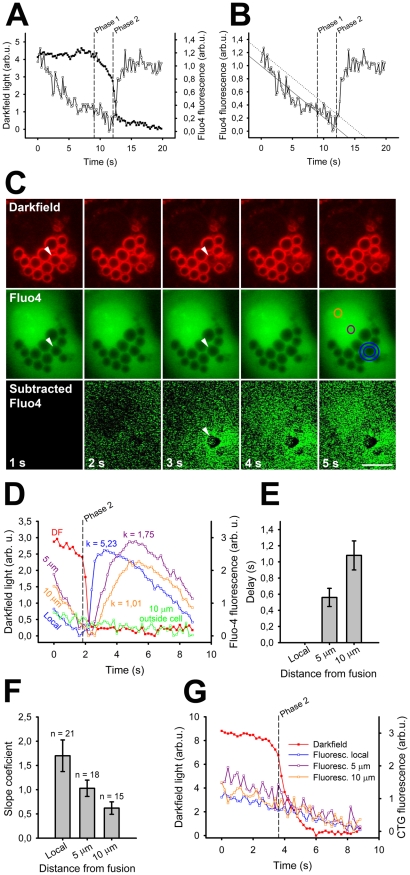
Figure 2. Fusion-activated Ca2+ entry in darkfield and Fluo-4 experiments and propagation of the local Ca2+ increase.
(A) Decrease in darkfield light intensity at the time of fusion (filled squares) mostly occurred in 2 phases. Phase 1 (slow decrease) was shown in a previous study to reflect lipid mixing (left dashed line), phase 2 (steep decrease) was shown to reflect fusion pore opening (right dashed line). The start in Fluo-4 fluorescence increase (open squares) corresponded to the start of phase 2 in darkfield light decrease. We confirmed that the darkfield events indeed represented fusion of the LB with the plasma membrane by observing surfactant squeezing through the fusion pore in darkfield light (n = 12) or by subsequent staining of the fusion events with FM 1-43 (n = 11). (B) To determine the start of the Fluo-4 fluorescence increase the pre-fusion part of the fluorescence data was fitted by a linear regression (solid line). The first data point which exceeded the noise level of the last 2 s before the fusion (dotted line) was taken as the starting point. (C) Alveolar type II cell in darkfield and fluorescence during one LB fusion event with the plasma membrane, stimulated by ATP (100 µm) and PMA (300 nM; arrowhead). The bottom row shows the subtracted Fluo-4 fluorescence images (the first fluorescence image was subtracted from all others). Note the localized Fluo-4 increase at 3 s and the subsequent spreading over the cell. The start of the phase 2 in the darkfield recording was at 1.8 s (see graph on Figure 3D). The fusing vesicle appears darker as the others, which might happen if LBs contain a minor amount of Fluo-4, which can diffuse out of the vesicle when the fusion pore is open (see also Video S1). Scale bar = 8 µm. (D) The decrease in darkfield light intensity (red) together with Fluo-4 fluorescence measured locally (blue), 5 µm (violet) and 10 µm (orange) from the site of the fusion event shown in C. The green line indicates Fluo-4 fluorescence measured 10 µm from the vesicle outside the cell (see Figure S1). Times in D correspond to the ones in C. The dashed line indicates the start of phase 2 in the darkfield recording and k indicates the slope coefficient of Fluo-4 increase. (E) Delay of onset of the Fluo-4 fluorescence increase (n = 15) as a function of the distance from the site of fusion. The time of the local Fluo-4 fluorescence increase was set to 0 s and the delays 5 and 10 µm distant from the site of fusion are relative to the time point of the local increase. (F) Comparison of the slope coefficients for the Fluo-4 fluorescence increase measured at different distances from the site of fusion. (G) Example of LB fusion in an alveolar type II cell stained with CellTracker Green (CTG), a Ca2+ insensitive dye. CTG fluorescence around the fusing LB did not change at the time of fusion. The general decrease of fluorescence before fusion in D and G was due to photobleaching.

