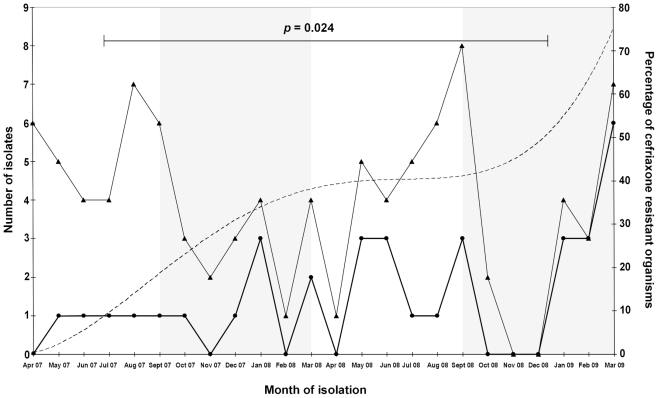
Figure 1. Graph depicting an increase in number and proportion of ceftriaxone resistant Shigella spp. isolated between April 2007 and March 2009 at the hospital for tropical diseases in Ho Chi Minh City.
The thick black line with circles represents the number of ceftriaxone resistant Shigella isolates per month (x axis); the thin black line with triangles represents the total number of Shigella isolates per month (both related to the left y axis). The broken line represents the proportion of strains isolated in six month periods resistant to ceftriaxone (right y axis). The increasing proportion of ceftriaxone resistant organisms over six month periods is statistically significant (p = 0.024) as calculated using the chi-squared test.

