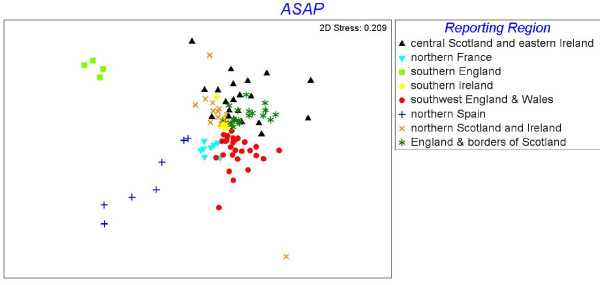
Figure 3.
Multi-dimensional scaling plot of genetic distances between the samples of Atlantic salmon analysed in this study. The DA distance measure of Nei et al. [49] was used. Colours denote reporting region and follow Fig. 2: northern England & borders of Scotland (dark green), southwest England & Wales (red), northern Spain (blue), southern England (light green), northern France (light blue), southern Ireland (yellow), northern Scotland and Ireland (orange), central Scotland and eastern Ireland (black).

