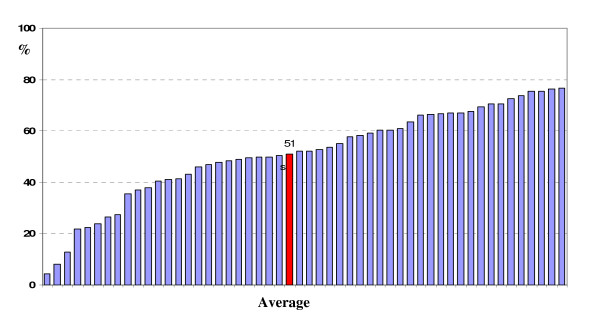
Figure 2.
Overall delivery of diabetes services by health centre (includes data for participating service up to 2008). The overall adherence to delivery of scheduled services for each patient was calculated by dividing the sum of services delivered by the total number of scheduled services and expressing this as a percentage. Each bar in the chart represents the average for overall delivery of scheduled services for clients in each health centre participating in the project. The highlighted bar shows the average for all health centres.

