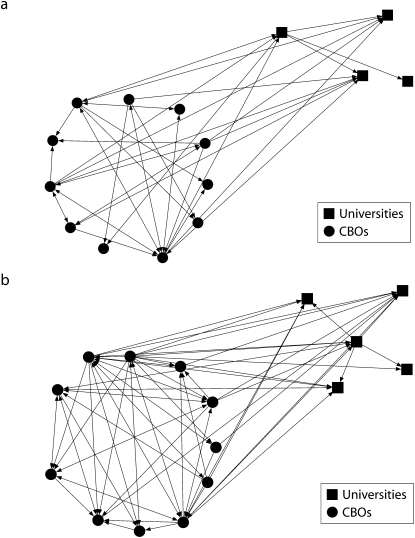
FIGURE 1.
Cancer education network at (a) June 2005 (time 1) and (b) July 2007 (time 2).
Note. The links indicate greater than average (based on the median) communication between organizations. There is an increase in linkage from CBOs to universities but not from universities to CBOs. Figures were created with Netdraw visualization software version 2.087 (Analytic Technologies, Lexington, KY).

