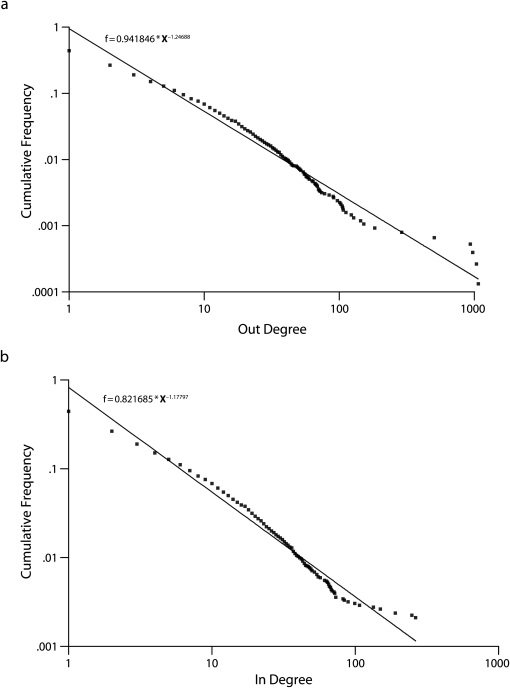
FIGURE 2.
Cumulative frequency of connections between individuals derived from Qmail exchanges on QuitNet for (a) out-degree log plot distribution and (b) in-degree log plot distribution: March 1, 2007–April 30, 2007.
Note. The slope of the solid line is represented by the f equation. In degree refers to the total number of individuals connected to an actor (someone with connections to others in the network) by incoming ties, and out degree to the number of individuals tied to an actor by outgoing ties. Although both plots approximate a straight line beyond approximately 150 degrees, the in-degree frequency sharply drops at that point, and the out degree trails in the opposite direction.

