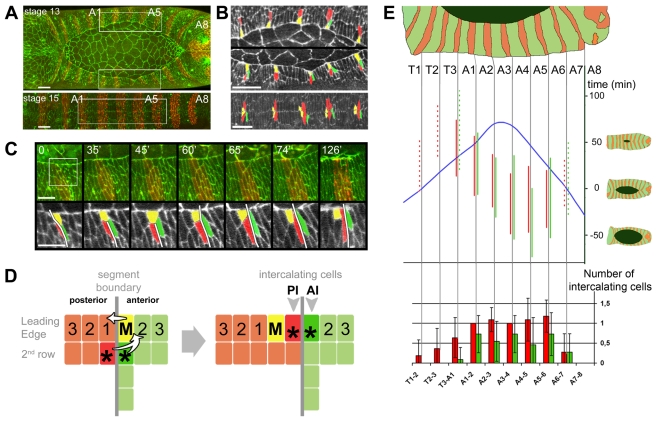
Figure 1. Cell mixing and intercalation at the segment boundaries during dorsal closure.
(A) Still confocal images from stage 13 and stage 15 live embryos expressing ubiquitous βCatenin-GFP (green) and Actin-CFP (red) specifically in the posterior compartments (en>actin-CFP). (B) High magnifications of bracketed regions in (A) (A1–A5 segments) showing spatial organization of Mixer cells (yellow) and intercalating cells (green and red). (C) Still images from Video S2 showing the dynamics of mixing and intercalation at the A3-A4 boundary (white line). (D) Scheme of cell mixing and intercalation at the segment boundary (M, Mixer cell; AI, anterior intercalating cell; PI, posterior intercalating cell). (E) Upper part: timing and extent of anterior and posterior intercalations (vertical green and red lines, respectively) relative to the time of segment closure (blue curve) (n = 5 independent embryos staged with time 0 corresponding to the closure of segment A7, means ± s.d. are given in Table S1). Continuous line: cell intercalates in more than 50% of cases. Dotted line: probability <50% (according to values found in bottom part). Bottom part: final number of intercalating cells at each segment boundary (data are mean ± s.d. with n = 11). Scale bars: 20 µm in (A) and (B), 10 µm in (C).

