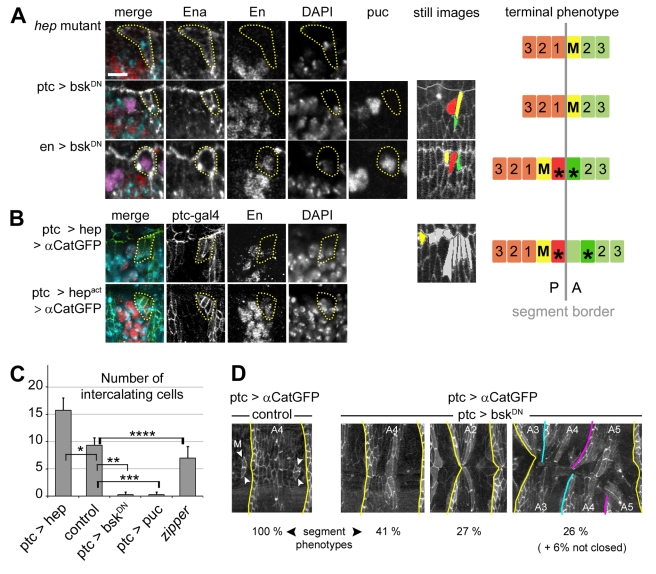
Figure 4. JNK signalling controls En expression in mixer cells.
(A, B) Pattern of cell mixing and intercalation in JNK loss and gain of function embryos. A summary of the terminal phenotypes is shown on the right panel. Ena, white; Ptc, green; DAPI, turquoise; β-Galactosidase (puc-lacZ), purple; En, red. Still images from live embryos show terminal phenotypes using the colour code as in Figure 1D: mixer (M) cell, yellow; anterior and posterior intercalating cells, green and red, respectively; unidentified intercalating cells, gray. (A) Cell mixing, cell intercalation, and En expression in the mixer cell (yellow dotted circle) are blocked in hep mutants and when JNK signalling is selectively down-regulated in the anterior compartment (ptc>bskDN). Quantification of En expression in hep mutants is shown in Figure 2B. Mixing, intercalation, and En expression are normal when JNK signalling is down-regulated in the posterior compartment (en>bskDN). (B) Up-regulation of the JNK pathway in the anterior compartment (ptc>hep or ptc>hepact) induces ectopic mixer cells expressing En in the groove. (C) Total number of intercalating cells per leading edge from wild type (n = 6), ptc>hep (n = 8), ptc>bskDN (n = 6), ptc>puc (n = 10), and zipper mutant (n = 5) backgrounds. Data are means ± s.d. (* p = 0.0015, ** p = 0.0026, *** p<0.001, **** p = 0.06). (D) Segment mismatching in ptc>αcat-GFP, bskDN embryos. Percentages of defects are given for segments A1 to A6 (n = 144 segments of 24 embryos). Scale bars: 5 µm.

