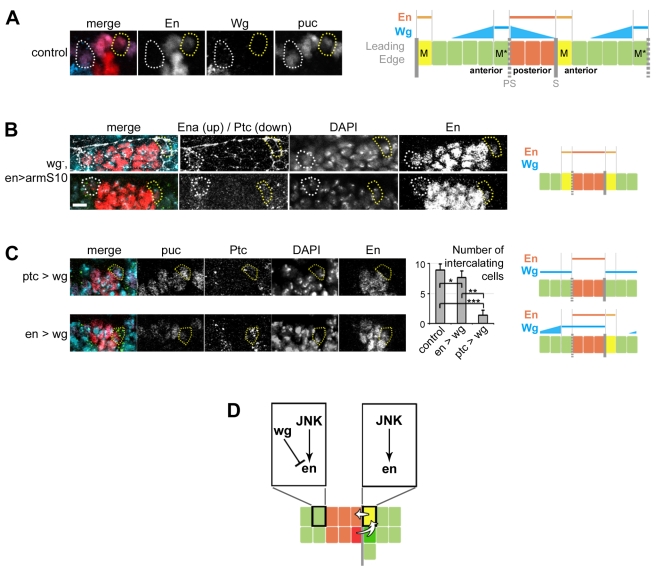
Figure 5. Wg inhibits groove and Mixer cell formation at the parasegment boundaries.
(A) Leading edge expression of En and Wg in stage 13 embryos; mixer cell (M), yellow dotted circles; mixer mirror cell (M*), white dotted circles; En, red; Wg, turquoise; β-Galactosidase (puc-lacZ), purple. (B) Specific loss of wg signalling induces ectopic mixer cell formation at the parasegment boundary as seen by expression of Ena (white, top) and En (red, top and bottom); Ptc (green, bottom); DAPI is turquoise. (C) Overexpression of Wg in the mixer cell (ptc>wg, top panel) inhibits anterior-to-posterior reprogramming as seen by the absence of En in the mixer cell, leading to the absence of the mixing (see Video S6). Overexpression of wg in the posterior compartment (en>wg, bottom panel) has no effect on reprogramming and mixing. The histogram shows the total number of intercalating cells for control (n = 8), ptc>wg (n = 8), and en>wg (n = 6) embryos. Data are means ± s.d. (* p = 0.06, ** p = 0.0012, *** p = 0.0005). β-Galactosidase (puc-lacZ), purple; Ptc, green; DAPI, turquoise; En, red. (A–C) (right panels) Scheme of the phenotype and expression patterns of Wg and En; PS is for parasegment boundary and S for segment boundary. (D) Model of JNK induced reprogramming at the segment boundary and Wg inhibition at the parasegment boundary. Scale bars: 5 µm.

