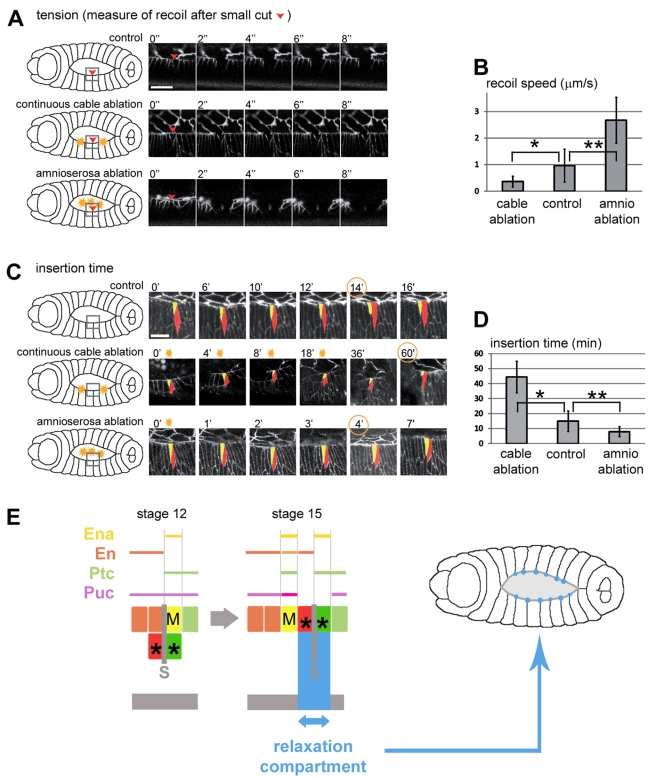
Figure 6. Local tissue tension modifies the dynamics of cell intercalation.
(A) Still confocal images showing cable recoil following laser ablation (from stage 14 live embryos expressing βCatenin-GFP, in gray). Single cell ablations are done in the mixer cell of a central segment (red arrowheads). The upper panel shows ablation in a control embryo cut once. The middle panel shows the recoil following a double ablation targeting adjacent segments (yellow sparkles in scheme on the left side). The bottom panel shows the recoil following the ablation of half of the amnioserosa (see scheme on the left side). (B) Indirect measurements of local tension at the segment boundary (recoil speeds) in control embryos, embryos with cable ablation, and embryos with amnioserosa ablation (n = 6, 3, and 6, respectively). Data are means ± s.d. (* p = 0.167, ** p = 0.048). (C) Still confocal images showing the timing of insertion in the leading edge of a control embryo (upper panel), and embryos with continuous cable ablation (middle panel) or with amnioserosa ablation (bottom panel). Mixer cell, yellow; posterior intercalating cell, red. (D) Timing of the final phase of intercalation (leading edge insertion) in all three conditions (control, n = 22; cable ablation, n = 2; amnioserosa ablation, n = 11). Data are means ± s.d. (* p = 0.032, ** p = 0.085). (E) Scheme showing the relaxation (blue arrow) at the segment boundary as a result of cell rearrangements (left panel) and the pattern and variability of relaxation from segment to segment (blue circles of variable sizes, right panel). Scale bars: 10 µm in (A) and (C).

