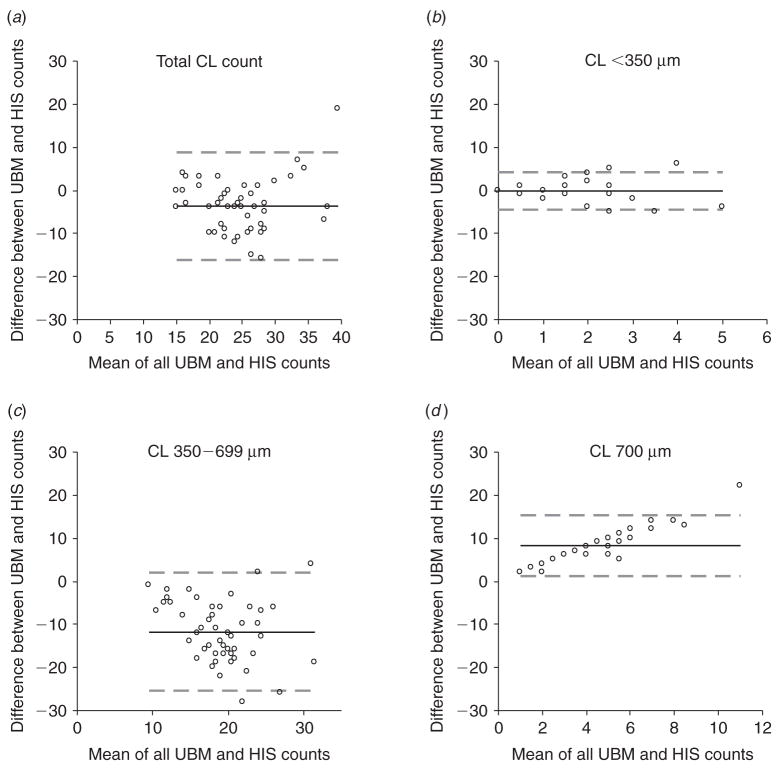
Fig. 4.
Bland-Altman plots for differences in corpora lutea counts made by ultrasound biomicroscopy (UBM) and histology (HIS) for (a) the total number of CL, (b) CL <350 μm in diameter, (c) CL between 350 and 699 μm in diameter and (d) CL ≥700 μm in diameter. Difficulty in distinguishing between adjacent CL caused CL 350–699 μm to be underestimated and CL ≥700 μm to be overestimated. Bias is represented by a solid line. Limits of agreement are represented by dashed lines.

