Fig. 3.
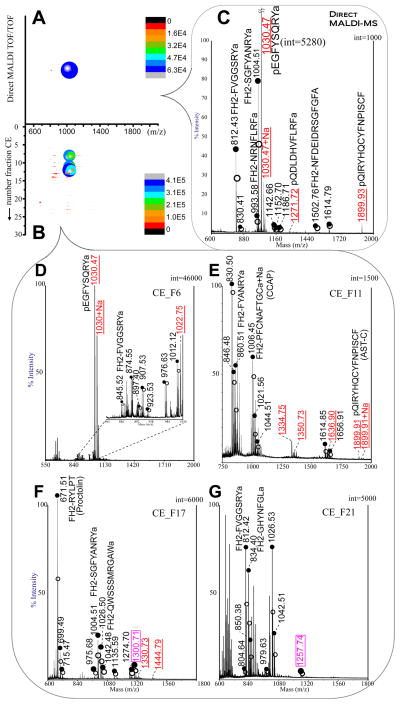
(A–B) Bubble-mapped 2D plot of the MALDI-TOF/TOF data from: A) 500 nL of extract without CE separation, and B) 50 nL after CE separation for the sample in Fig. 2. (C) MALDI TOF/TOF spectrum from direct spotting sample. (D–G) CE-MALDI-TOF/TOF of fractions #6, 11, 17 and 21, respectively. Closed circle indicates lightly labeled peptide peak in a pair and open circle indicates heavy labeled peptide peak in a pair. Amino acid sequences (begin with FH2) were given for known peptides with light labeling reagent. Underlined label in red represents N-terminus blocked (unpaired) peptides. Boxed label in purple represents doubly labeled peak pairs (8.05 Da mass shift). CE condition: 75 cm × 50 μm i.d. × 360 μm o.d. The CE runs under −18 kV using ammonium formate buffer (50 mM, 10% ACN, pH 3.5) at room temperature, 20 °C.

