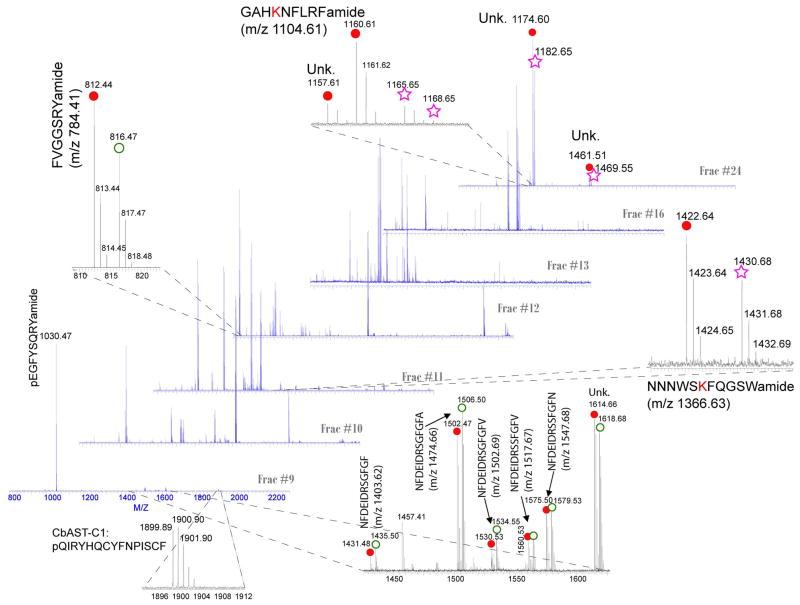
Fig. 4.
CE-MALDI-FTMS profiling of pericardial organs from C. maenas (green color morph) in response to low salinity. Seven representative spectra from fractions #8 to #25 are shown. Red closed circle ( ) shows lightly labeled peptide peak in a pair (4.03Da mass shift), green open circle (
 ) shows peak in the pair with a heavy label. Purple open pentagram (
 ) shows peak pairs with 8.05Da mass shift. CE conditions are the same as in Fig. 3.

