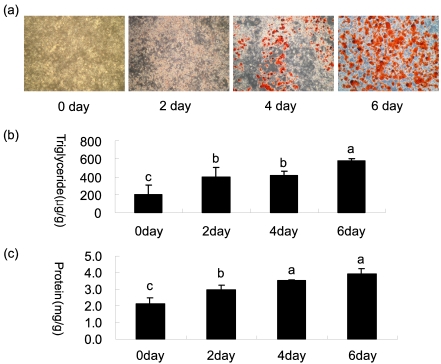
Fig. 1.
Histological and biochemical analysis of adipocyte differentation
Post-confluent 3T3-L1 cells were hormonally treated with differentiation cocktail (1µ M dexamethasone, 5 µg/ml insulin, and 0.5 mM IBMX) for 6 days as described in the Methods section. (a) The cells were fixed at the indicated time points and stained with Oil Red O to assess lipid accumulation (100× magnification). (b) (c) Data of triglycerides and protein are expressed as mean ± S.D (n = 3). Asterisks denote significant difference (ANOVA) between the control and differentiation cocktail treatment on days 2, 4 and 6 (p<0.05).

